LBO Model Excel Template, Pro Edition
An integrated leveraged buyout model in Excel: sources and uses, a seven-year plan, four debt tranches without a circular reference, covenants, a management package and sponsor returns, with 31 built-in checks.
Enter the price, the financing, the plan and the management terms. The workbook builds the sources and uses, projects seven years, runs four debt tranches without a circular reference, tests the covenants, values the exit and splits the proceeds between sponsor and management.
LBO Model, Pro Edition: $99
One zip file: the model with a worked example, a blank copy and an 18-page PDF user guide. Single-user license.
Secure checkout by Stripe. Also in the Pro Models Bundle, $199 for the three Pro models. Want to try the method first? The free LBO model template stays free.
Want to learn to build it yourself? The video course rebuilds this model from a blank sheet, step by step, and includes the Pro model.
Watch the five-minute demo
- 0:00 An LBO with no circular reference
- 0:25 Inputs: transaction, plan, debt, management
- 1:30 Debt schedule: revolver, cash sweep, notes, PIK
- 2:20 Covenants and headroom
- 2:49 Management package and ratchet
- 3:28 Returns, value bridge, scenarios, sensitivity
- 4:36 The 31 integrity checks
- 4:56 What you receive
The worked example uses a fictitious company. AI-generated voice over real captures of the workbook. Not investment advice.
What the model does, tab by tab
The tabs run from inputs to outputs. Blue text on a pale yellow fill marks an input; every other cell is a formula.
- Cover
- What the model does, the color code, how to use it, the no-circularity design, conventions, limitations, version and license.
- Dashboard
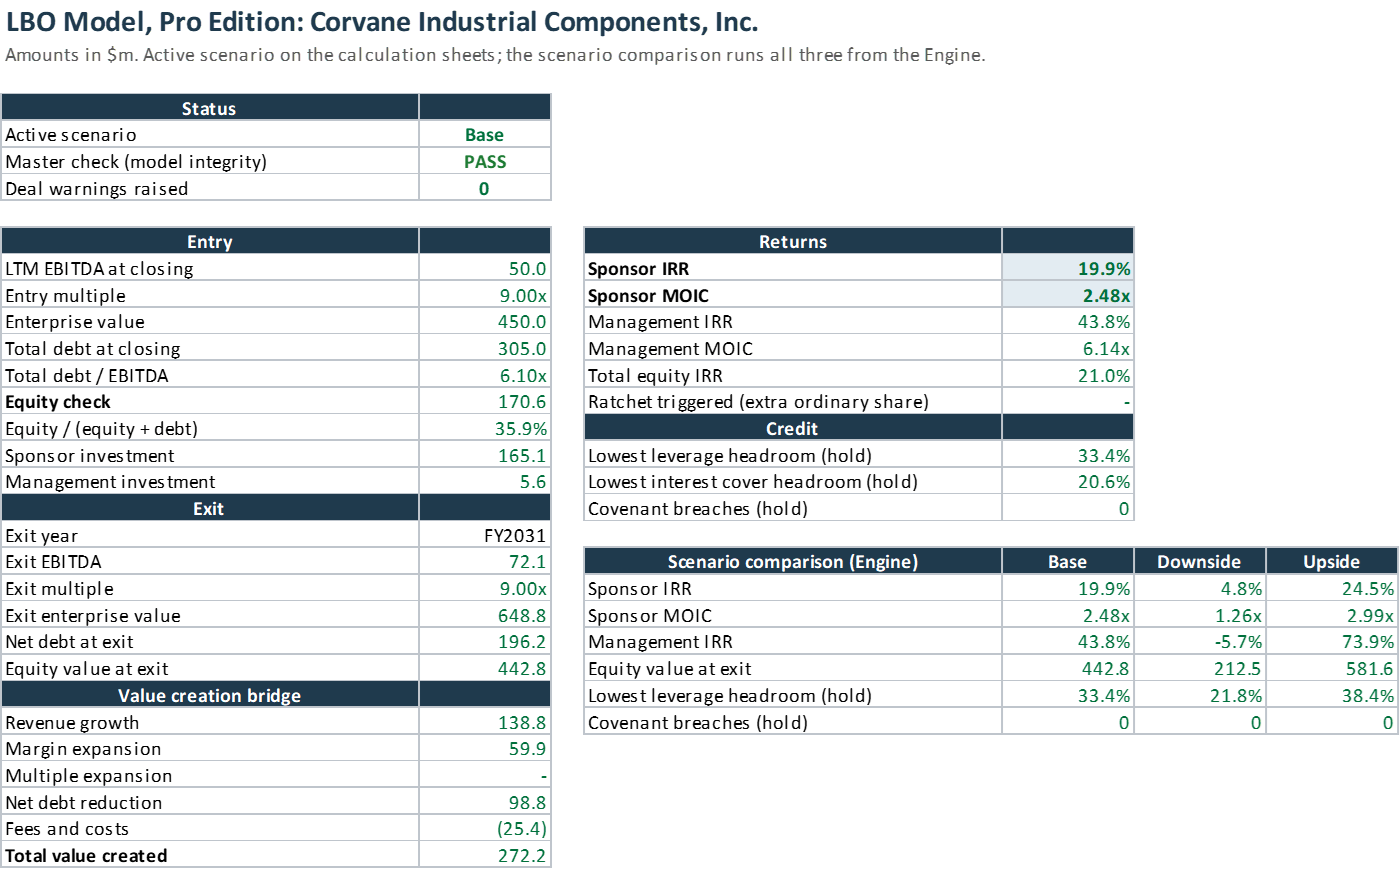
- Status and master check, entry and exit figures, the value creation bridge, returns, credit headroom, the three scenarios side by side, and two charts: debt by tranche, revenue and EBITDA.
- Inputs
- Company and timing, entry valuation, three revenue lines, operations and tax, the four tranches, financing fee amortization, equity structure and management package, exit.
- Plan
- Year-by-year assumptions: growth by line, SG&A and capex as a % of revenue, receivable, inventory and payable days, the base rate curve, covenant levels.
- Scenarios
- The active scenario selector, and the Base, Downside and Upside shifts to growth, EBITDA margin, base rate and exit multiple.
- Transaction
- Entry valuation, uses, debt raised, sources, credit statistics at closing, equity structure and management investment.
- Operations
- Revenue lines, gross profit, EBITDA, the income statement down to net income, tax losses, working capital, capex.
- Debt
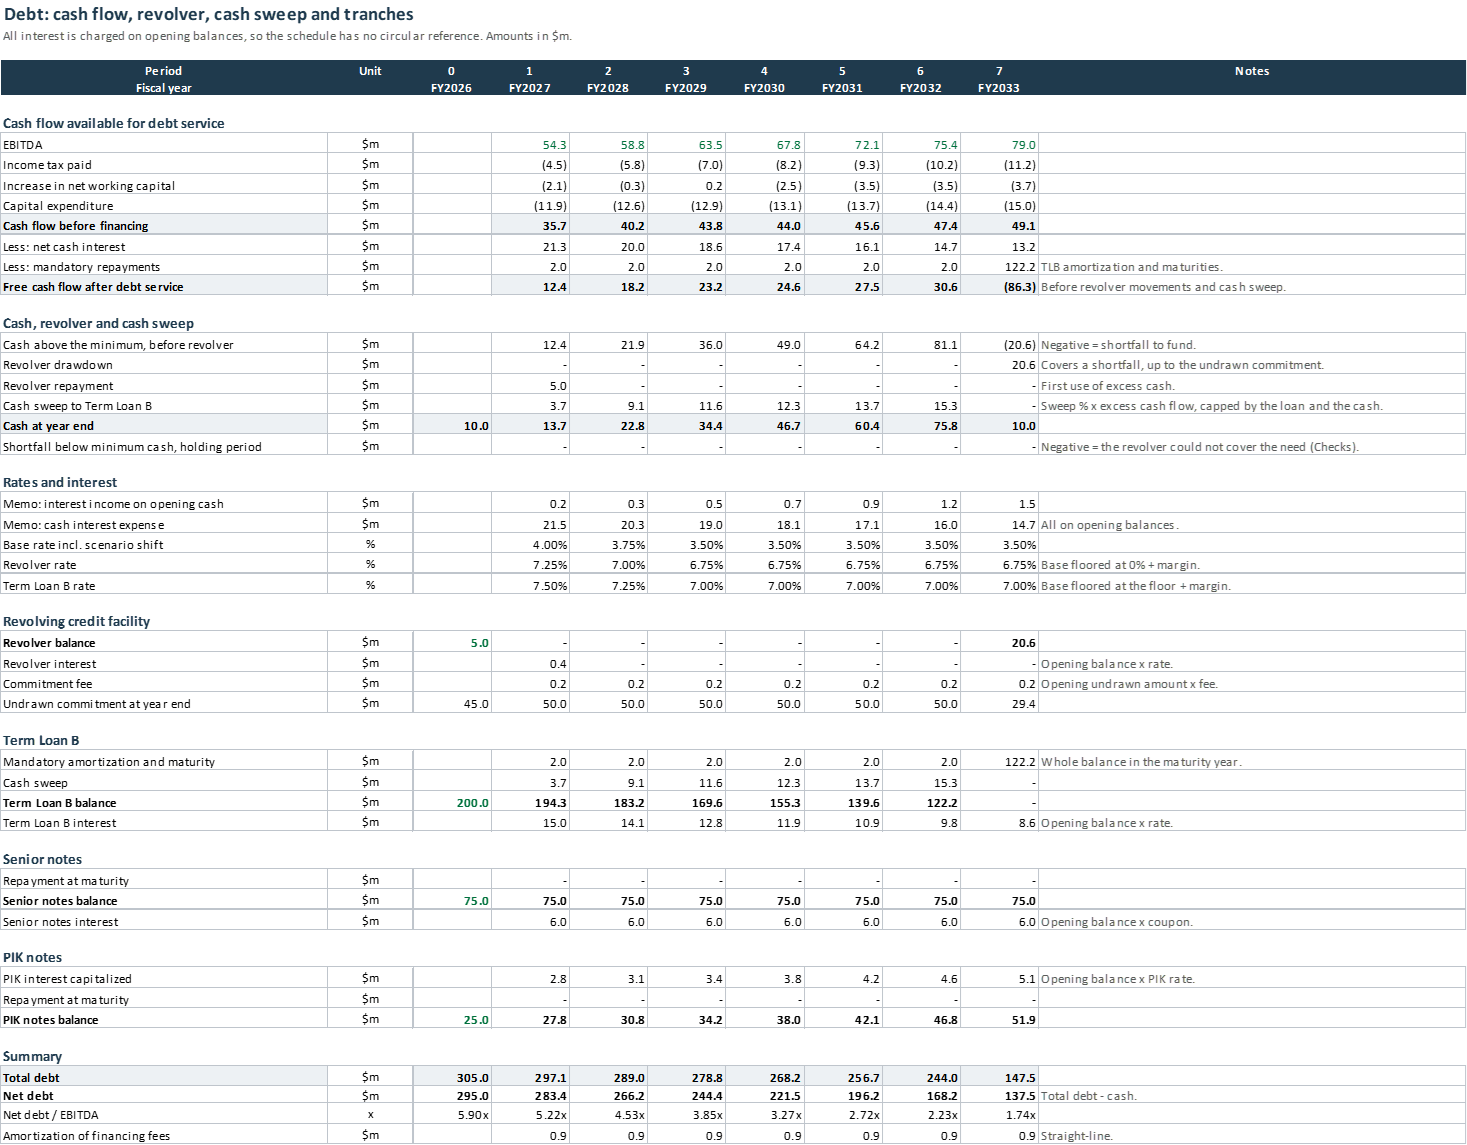
- Cash flow available for debt service, the revolver, the cash sweep, rates, each tranche's schedule, net debt and leverage.
- Covenants
- Senior net leverage and interest cover each year against their maximum and minimum, headroom, PASS or BREACH, and a holding period summary.
- Returns
- Exit valuation, the exit waterfall and the ratchet, IRR and MOIC, the value creation bridge, equity cash flows.
- Sensitivity
- Sponsor IRR and MOIC for 25 combinations of entry and exit multiple around the active case.
- Checks
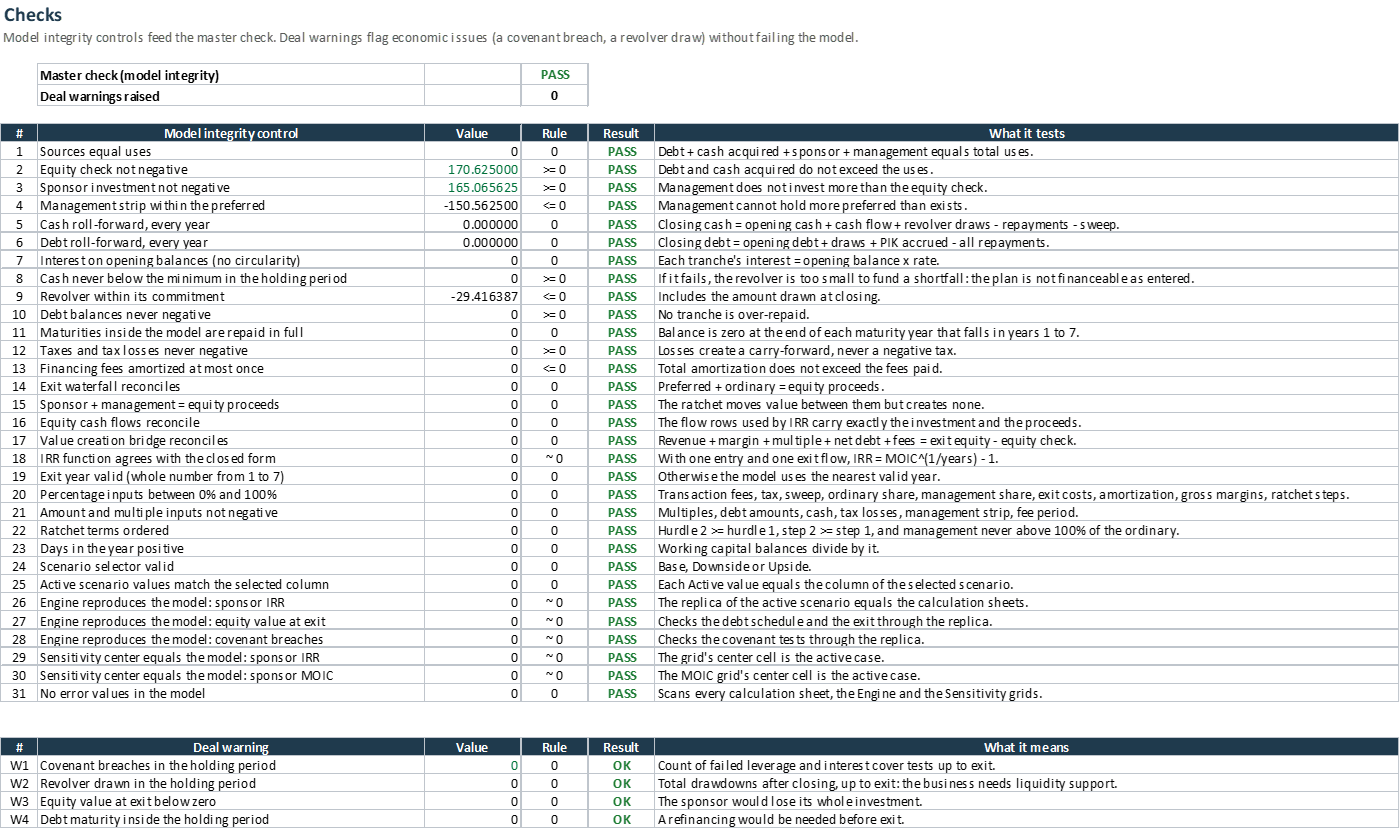
- The master check, 31 integrity controls with value, rule, result and purpose, and 4 deal warnings.
- Engine
- Three full replicas of the calculation sheets, one per scenario, and the 25-column block behind the grid. No inputs.
The worked example
The example is Corvane Industrial Components, a fictitious US maker of engineered components. A sponsor buys it at the end of FY2026 for 9.00x LTM EBITDA of $50.0 million and sells it after five years. Base case, amounts in $ millions:
| Measure | Value |
|---|---|
| Enterprise value at entry | 450.0 (9.00x EBITDA) |
| Total debt at closing | 305.0 (6.10x EBITDA) |
| Equity check | 170.6 (35.9% of capitalization) |
| Equity value at exit, FY2031 | 442.8 |
| Sponsor IRR / MOIC | 19.9% / 2.48x |
| Management IRR / MOIC | 43.8% / 6.14x |
| Lowest covenant headroom | 33.4% leverage, 20.6% interest cover |
| Downside: sponsor IRR / MOIC | 4.8% / 1.26x |
| Upside: sponsor IRR / MOIC | 24.5% / 2.99x |
With no multiple expansion assumed, the 272.2 of value created comes from revenue growth and margin (73%) and from deleveraging (36%), net of 25.4 of fees and costs. In the sensitivity grid, half a turn more at entry costs 3.0% of sponsor IRR, while half a turn more at exit adds 1.1%. In the Downside, interest cover in year 1 is 2.01x against a 2.00x minimum: the test passes, barely, which is what a lender would look at first. The example and every figure in it are fictitious and illustrative.
Who it is for
- Deal teams screening or structuring a buyout.
- Lenders and credit analysts who want to see how much debt the cash flows carry.
- Management teams negotiating a package.
- Students of private equity who want a model they can take apart line by line.
What you receive
- The model with a worked example: a fictitious US industrial company with an enterprise value of $450 million.
- A blank copy ready for your own deal. It carries standard financing and management terms and computes without error while it is empty.
- An 18-page PDF user guide: every sheet, the mechanics, the checks and a walk-through of the example.
- A short read-me file. Everything comes in one zip file, downloaded right after checkout.
Technical notes
- Annual periods over seven years, amounts in $ millions.
- Standard formulas only: no macros, no data tables, no circular references, no external links, no locked cells.
- Interest is charged on opening balances, so the debt schedule needs no iterative calculation.
- Built for Excel, LibreOffice and Google Sheets. Charts may render slightly differently outside Excel.
- Each configuration of the model was recalculated in LibreOffice and compared cell by cell with an independent Python implementation, with no mismatch and no error cell.
- Limitations, stated in the guide: annual rather than quarterly, one tranche of each kind, no dividend recapitalization or add-on acquisitions, a simplified tax (single rate, no interest deductibility cap).
- Single-user license. Not investment advice. Prepared with AI assistance.
Questions people ask about it
Does the LBO model use macros or circular references?
No. Every interest charge is computed on the opening balance of the year, so the debt schedule runs one way: no iterative calculation, no macro, no data table. A built-in control proves that each tranche's interest equals its opening balance times its rate in every year.
Does it work in Google Sheets and LibreOffice?
Yes. It uses standard functions only and was recalculated and verified with LibreOffice. Charts may render slightly differently outside Excel.
How is it different from the free LBO model template?
The free template works one deal from The Buyout Investor. The Pro Edition is a general tool, not tied to any case: it chains the transaction, the operations, four debt tranches, covenants, the management package and the returns, switches between three scenarios and verifies itself with 31 controls. The free template stays free.
What do I receive after purchase?
One zip file with the model and its worked example, a blank copy for your own deal, and an 18-page PDF user guide.
What does the model leave out?
It is an annual model with one tranche of each kind. There is no dividend recapitalization, no add-on acquisition and no interim distribution, and tax is simplified to a single rate with unlimited loss carry-forward. The guide lists every simplification.
Can I use it on a live deal?
Yes, the blank copy is built for that. The license is single-user, the example company is fictitious, and nothing in the model is investment advice.
Get the LBO Model, Pro Edition
$99, single-user license. Download right after checkout. Digital download: no refunds once the file has been downloaded.
Start free with the free LBO model template, or read The Buyout Investor, the book behind it.
Other Pro models
- Real Estate Acquisition and Development Model, Pro EditionMonthly over 60 months, S-curves, construction loan and mezzanine, bulk or unit sales, JV waterfall, 33 checks, a 14-page guide. $99.
- Real Estate Fund Model, Pro EditionClosed-end fund, up to eight assets, fees, European or American waterfall, 30 checks, a 19-page guide. $129.
- The Pro Models BundleThe three Pro models in one purchase, $199 instead of $327.
Learn to build the whole model
Sixteen video lessons that build a complete LBO model in Excel on one case, from sources and uses to sponsor returns, with step files, exercises that check your answers, a 160-question quiz and the LBO Model, Pro Edition included ($149).