Real Estate Acquisition and Development Model in Excel, Pro Edition
A monthly ground-up development model over 60 months: S-curve costs, a fixed funding order, senior and mezzanine loans, a bulk sale or unit sales, and a JV waterfall. New in version 1.2: an Acquisition tab for a standing, leased property. 42 built-in checks.
Get this model inside the course: $149 instead of $99
Real Estate Modeling includes this model, with the course case on both the Acquisition and the development tabs, plus a 32-page Course Book, an Excel workbook that checks your answers and a 160-question quiz with a final exam. For $50 more than the model alone, you learn the whole analysis behind it.
Enter your land, budget, timing, exit and capital stack. The workbook spends the budget month by month, funds it in a fixed order, runs the exit and splits the profit between the investor and the developer.
Real Estate Acquisition and Development Model, Pro Edition: $99
One zip file: the model with a worked example, a blank copy and a 16-page PDF user guide. Single-user license.
Secure checkout by Stripe. Also in the Pro Models Bundle, $199 for the three Pro models. Want to try the method first? The free residual land valuation template stays free.
Watch the five-minute demo
- 0:00 Intro: a development model with no circular reference
- 0:27 Inputs: land, timing, exit, capital stack
- 1:12 Budget: hard costs on S-curves, soft costs by timing
- 1:48 Financing: equity, mezzanine, senior loan
- 2:27 Exit and returns: yield on cost, margin, IRR
- 3:13 JV waterfall: pref and promote
- 3:41 Scenarios, exit comparison, sensitivity
- 4:28 33 integrity checks
- 4:49 What you get
The example project is fictitious. AI-generated voice over real captures of the workbook. Not investment advice.
What the model does, tab by tab
The tabs run from inputs to outputs. Blue text on a pale yellow fill marks an input; every other cell is a formula.
- Cover
- What the model does, the color code, how to use it, conventions, financing logic, limitations, version and license.
- Dashboard
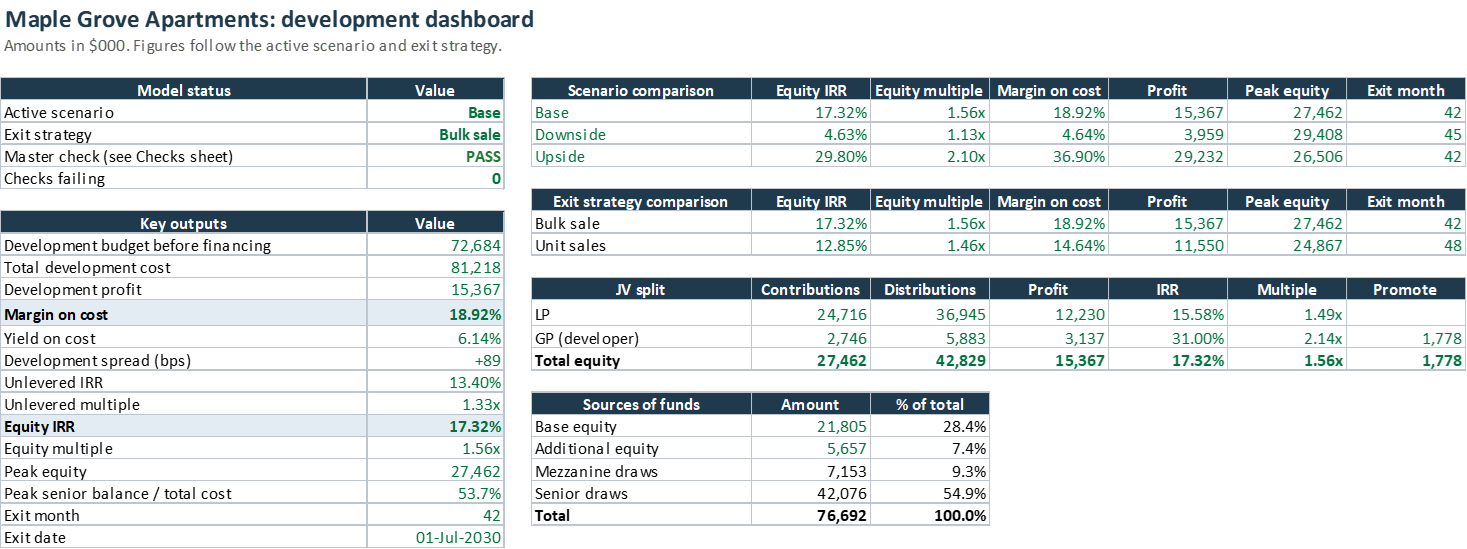
- Model status and master check, key outputs, scenario comparison, exit strategy comparison, JV split, sources of funds, two charts.
- Acquisition
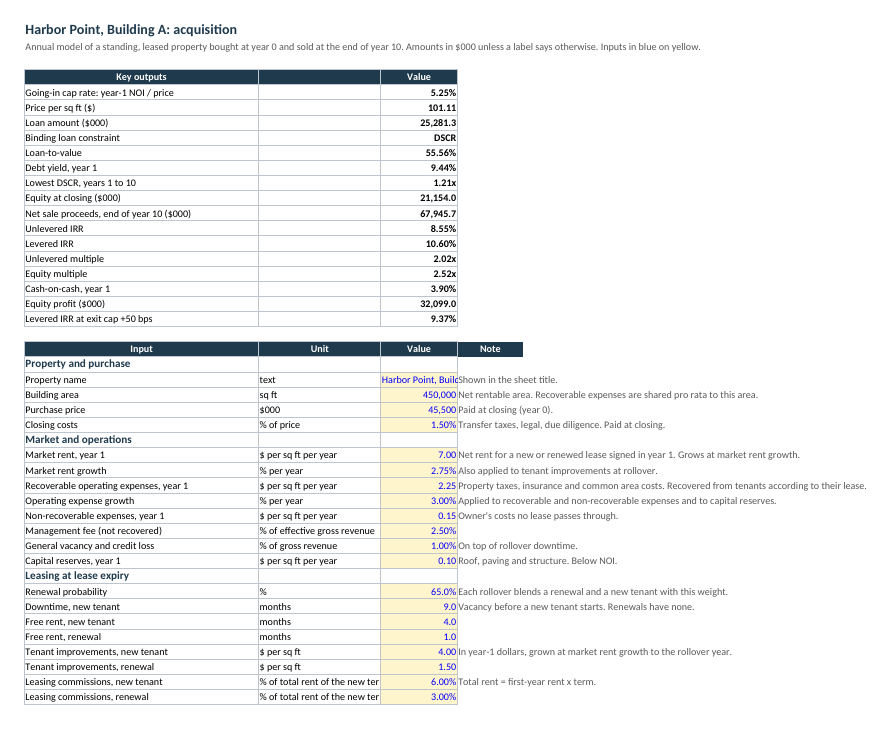
- New in version 1.2. A standing, leased property on one sheet: rent roll of up to 8 tenants (NNN, base-year or gross recoveries), rollover to market with a renewal probability, NOI, a loan sized by the smallest of LTV, DSCR and debt yield, the sale at the exit cap rate, unlevered and levered IRR, and an exit cap rate sensitivity.
- Inputs
- Project, land, timing, contingencies, exit strategy and its assumptions, financing, JV terms; then about 35 derived settings.
- Budget
- Eight hard cost lines (amount, start, duration, S-curve steepness) and eight soft cost lines (fixed and/or % of hard costs, timing), with status flags.
- Scenarios
- The active scenario selector and the Base, Downside and Upside shifts.
- Costs
- Land, each hard cost line by month, contingency, each soft cost line, totals and construction progress.
- Revenue
- The bulk sale block (lease-up, rents, NOI, sale), the unit sales block (closings, prices, carrying costs) and the active block.
- Financing
- Unlevered cash flow, fees, senior and mezzanine schedules, and the funding of each month.
- Cash Flow
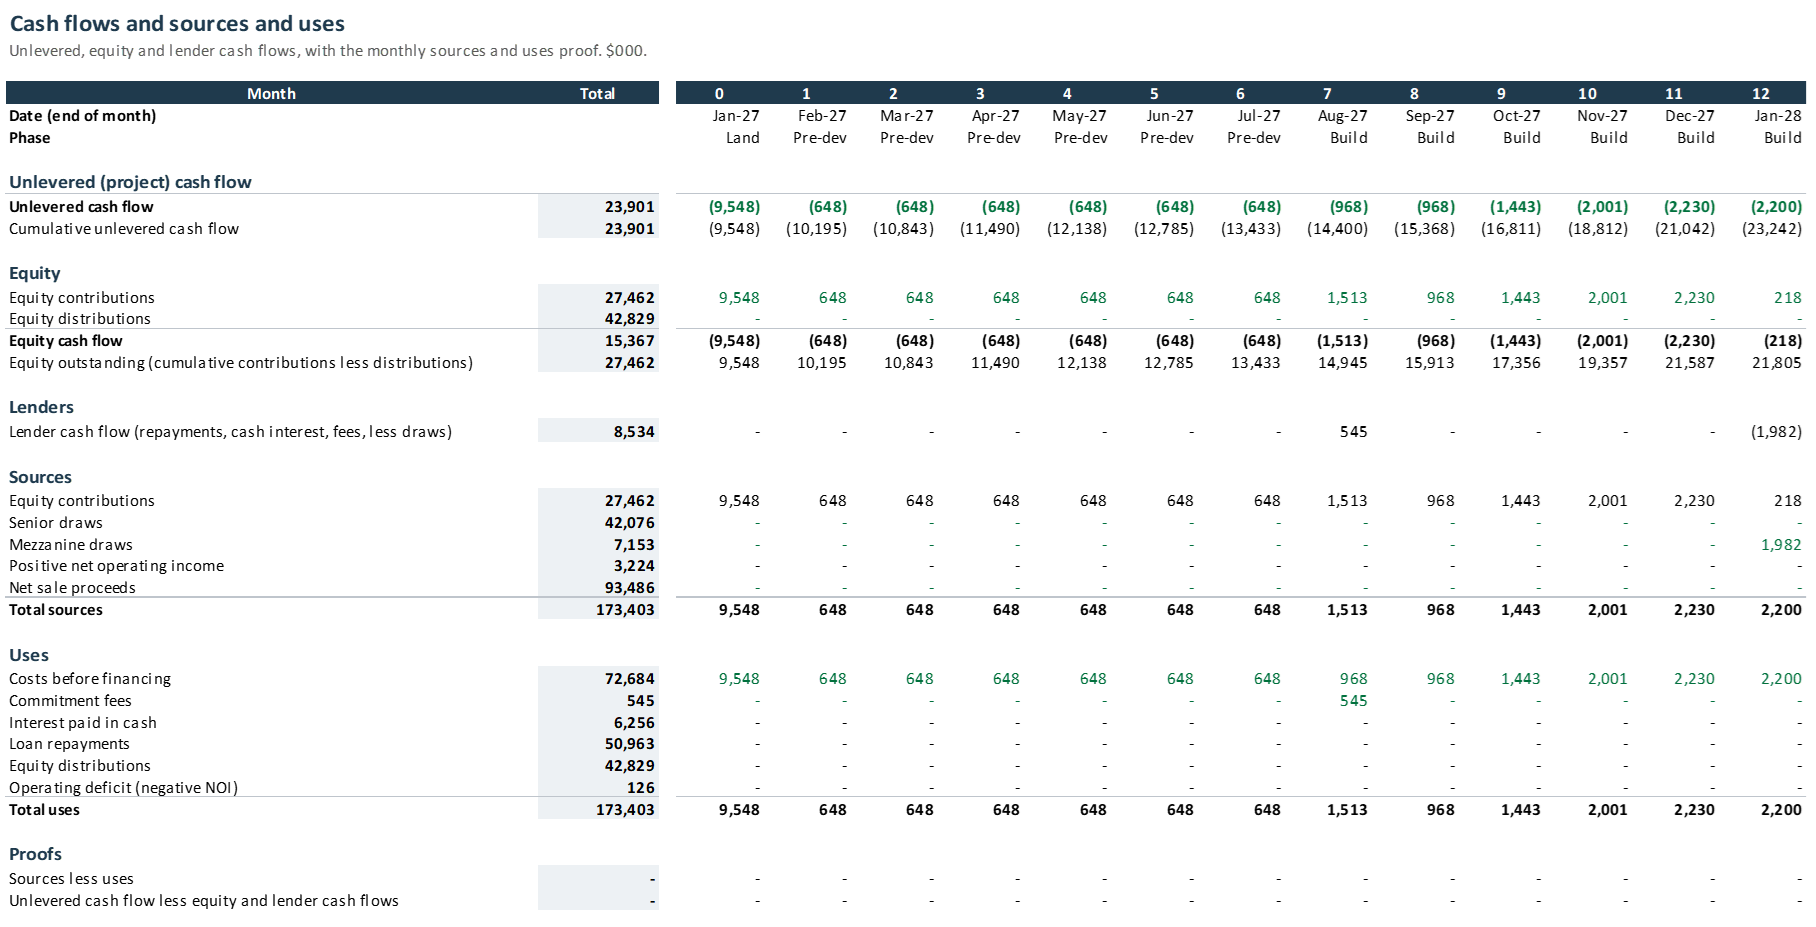
- Unlevered, equity and lender cash flows; sources and uses with two monthly proofs.
- JV Waterfall
- Hurdle account, tier 1, catch-up, tier 2, promote, flows by partner.
- Returns
- Cost, profit, metrics, returns and the JV table by partner.
- Sensitivity
- Equity IRR and margin on cost for 25 combinations of hard cost change and exit price change.
- Checks
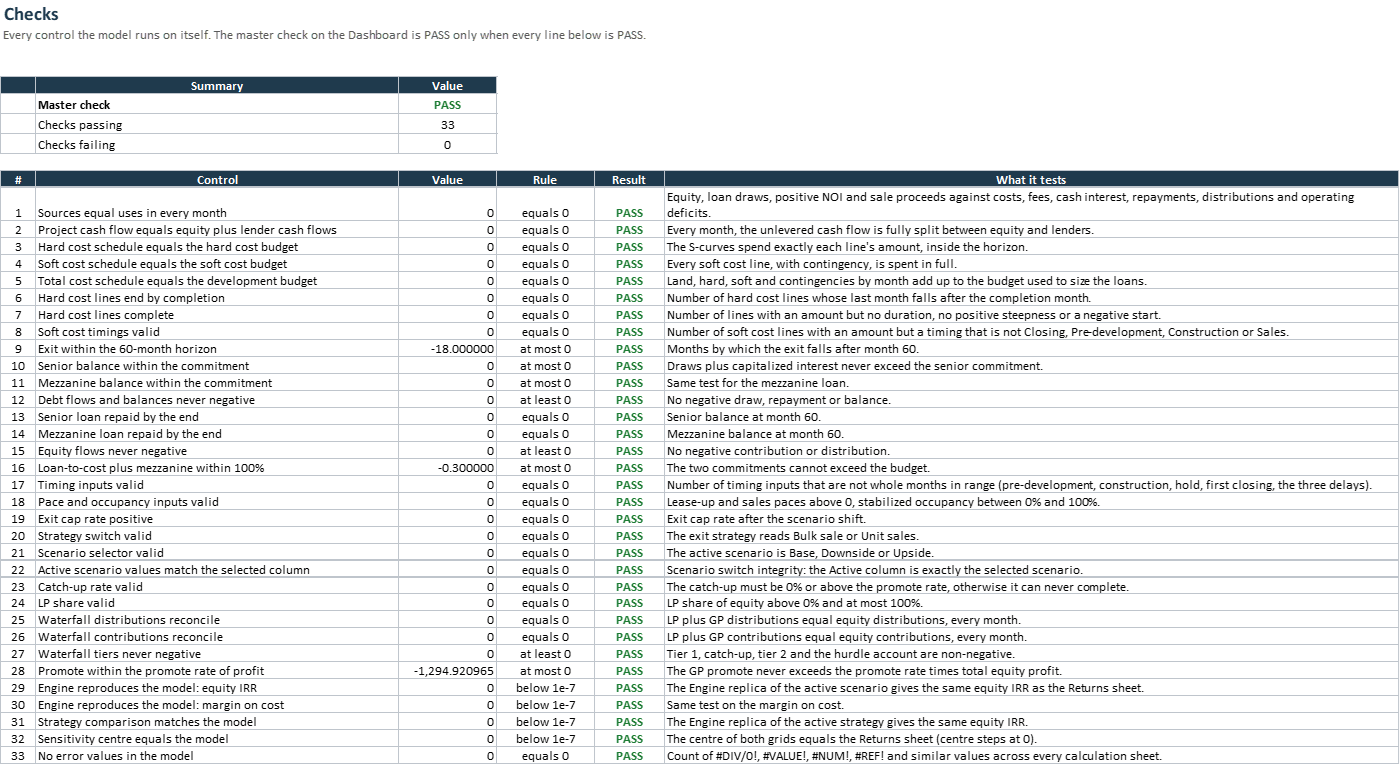
- The master check, then 42 controls with value, rule, PASS or FAIL and what each tests.
- Engine
- Thirty compact replicas of the monthly model, for the scenarios, the two exit strategies and the grid. No inputs.
The worked example
The example is Maple Grove Apartments, a fictitious 200-unit rental building on a $9.0 million site: 6 months of pre-development, 22 months of construction, then lease-up and a bulk sale. Base case, amounts in $000:
| Measure | Value |
|---|---|
| Development budget before financing | 72,684 |
| Total development cost | 81,218 |
| Development profit | 15,367 |
| Margin on cost | 18.9% |
| Yield on cost | 6.14% (+89 bps over a 5.25% exit cap) |
| Unlevered IRR / multiple | 13.4% / 1.33x |
| Equity IRR / multiple | 17.3% / 1.56x |
| Peak equity | 27,462 |
| LP IRR / developer IRR | 15.6% / 31.0% |
Selling the units one by one instead of the building earns an equity IRR of 12.9% here, because the slower sell-out carries the loans longer. In the Downside (hard costs +5.0%, rents -3%, cap +25 bps, senior rate +100 bps, a 3-month delay) the equity IRR falls to 4.6%. In the grid, a 10% hard cost overrun brings it to 10.1%, a 10% lower exit price to 7.5%: the scheme is more sensitive to the exit price than to hard costs. The example and every figure in it are fictitious and illustrative.
New in version 1.2: the Acquisition tab
The example on the Acquisition tab is Harbor Point Building A, a fictitious 450,000 sq ft multi-tenant warehouse bought at a 5.25% cap rate: the loan is sized by DSCR, and the tab shows NOI year by year, the coverage path, the sale and an 8.55% unlevered and 10.60% levered IRR. It is the running case of the Real Estate Modeling course.
Who it is for
- Developers preparing an investment memo or a lender package.
- Equity investors checking a sponsor's numbers.
- Analysts who want a transparent model they can audit cell by cell.
What you receive
- The model with a worked example: a fictitious 200-unit US apartment building.
- A blank copy ready for your own project.
- A 16-page PDF user guide: every sheet, the logic, the checks, the conventions and a commented walk-through of the example.
- A short read-me file. Everything comes in one zip file, downloaded right after checkout.
Technical notes
- Monthly periods over 60 months, amounts in $000.
- Standard formulas only: no macros, no data tables, no external links, no locked cells.
- No circular reference: the loans are sized on the budget before financing, and interest is charged on opening balances.
- Built for Excel, LibreOffice and Google Sheets. The Engine sheet holds 42,477 formulas, so the first recalculation can take a few seconds.
- Each configuration of the model was recalculated in LibreOffice and compared cell by cell with an independent Python implementation, with no mismatch and no error cell.
- Limitations, stated in the guide: up to 8 hard and 8 soft cost lines, one senior and one mezzanine loan, no tax, no presales or deposits on unit sales, a single-tier promote.
- Single-user license. Not investment advice. Prepared with AI assistance.
Questions people ask about it
Does the development model need iterative calculation?
No. The senior and mezzanine commitments are sized on the budget before financing, and interest is charged on opening balances, so there is no circular reference and no macro.
Can it model a condo sell-out as well as a build-to-rent sale?
Yes. It always calculates both exits: a bulk sale of the stabilized building at the exit cap rate, and unit sales at a monthly pace. A switch picks the one that drives financing and returns, and the Dashboard compares the two.
How is it different from the free residual land valuation template?
The free template works one development appraisal back to land value. The Pro Edition is a monthly cash flow model for a whole scheme: S-curve spending, the funding order, senior and mezzanine loans, two exit strategies, a JV waterfall, scenarios, an Acquisition tab and 42 controls. The free template stays free.
Does it work in Google Sheets?
Yes. Upload the file and open it: every function used is supported. The first recalculation can take a few seconds.
What does the model leave out?
Tax, depreciation, hedging, presales and deposits, refinancing at stabilization and a multi-tier promote. It holds up to 8 hard and 8 soft cost lines over 60 months. The guide lists every simplification.
Can I use it on a real project?
Yes, the blank copy is built for that. The license is single-user, the example project is fictitious, and nothing in the model is investment advice.
Get the Real Estate Acquisition and Development Model, Pro Edition
$99, single-user license. Download right after checkout. Digital download: no refunds once the file has been downloaded.
Start free with the free residual land valuation template, or read The Real Estate Development Manager, the book behind it.
Other Pro models
- LBO Model, Pro EditionSeven-year buyout, four debt tranches, covenants, management ratchet, 31 checks, an 18-page guide. $99.
- Real Estate Fund Model, Pro EditionClosed-end fund, up to eight assets, fees, European or American waterfall, 30 checks, a 19-page guide. $129.
- The Pro Models BundleThe three Pro models in one purchase, $199 instead of $327.